Home chart
R-Value Chart by Insulation Material and Thickness
R-value measures resistance to heat flow — higher is better, and it's additive when you stack materials. Comparing materials by R-value per inch is the fairest way to judge them, because a thin, dense material can outperform a thick, fluffy one in the same cavity.
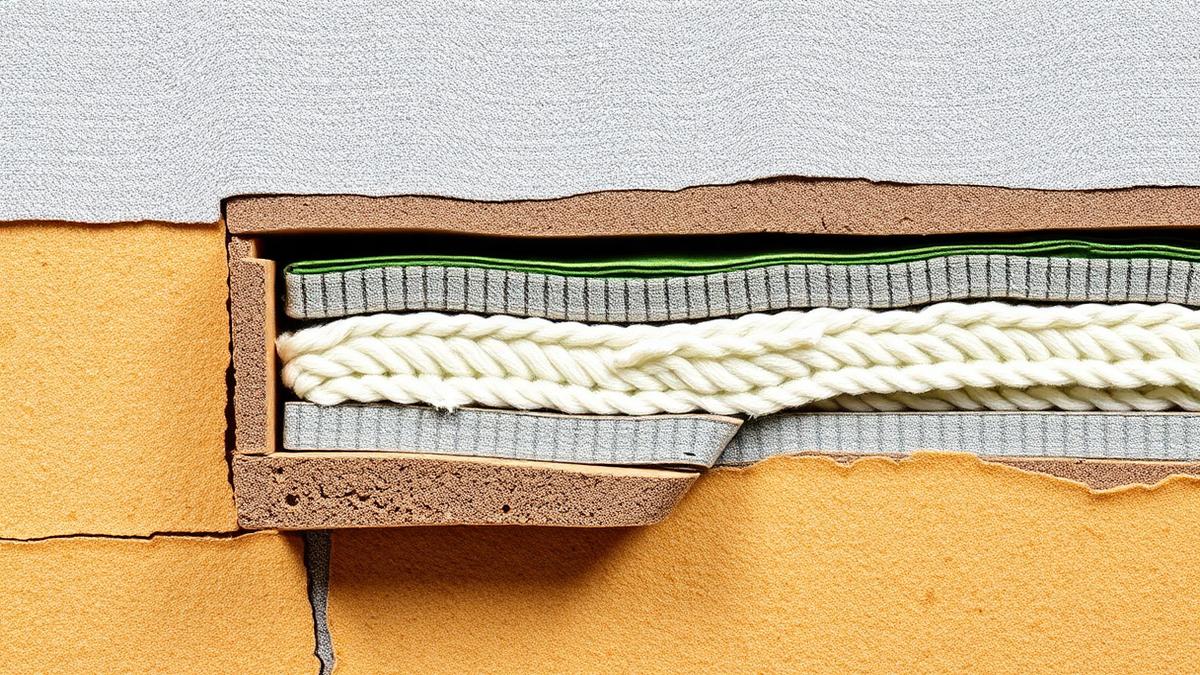
| Material | R-value per inch | R-value at typical installed thickness |
|---|---|---|
| Fiberglass batt | R-3.1 to R-3.4 | R-13 at 3.5 in, R-19 at 6.25 in |
| Blown fiberglass (attic) | R-2.2 to R-2.7 | R-38 at about 14–17 in |
| Blown cellulose (attic) | R-3.2 to R-3.8 | R-38 at about 10–12 in |
| Mineral wool (rock wool) batt | R-3.7 to R-4.2 | R-15 at 3.5 in, R-23 at 5.5 in |
| Open-cell spray foam | R-3.5 to R-3.7 | R-13 at 3.5 in |
| Closed-cell spray foam | R-6.0 to R-7.0 | R-21 at 3.5 in |
| Rigid foam board (XPS) | R-5.0 | R-10 at 2 in |
| Rigid foam board (polyiso) | R-6.0 | R-12 at 2 in |
| Rigid foam board (EPS) | R-3.8 to R-4.2 | R-8 at 2 in |
Notes
- Recommended attic R-values in the US range from R-30 in warm climates to R-60 in the coldest zones — check local building code, not a single national number.
- Compression reduces batt performance significantly — stuffing an R-19 batt into a 2x4 (3.5 in) cavity it wasn't sized for drops its effective R-value.
- Air sealing gaps before adding insulation typically saves more energy than upgrading insulation alone, because convective air leaks bypass R-value entirely.
Put this into practice
- Insulation R-Value CalculatorWhat R-value do I need, and how much?
- Energy Savings CalculatorWill this upgrade pay for itself?
More charts like this
- Paint Coverage Chart by Surface TypeHow far a gallon of paint typically goes on different surfaces, and why porous or textured surfaces need more coats.
- Tile Trowel Size Chart by Tile SizeWhich notched-trowel size to use for mosaic, small, and large-format tile, matched to typical thinset coverage.
- Concrete Bag Chart: Bags Needed per Cubic Yard and Cubic FootHow many 40, 60, and 80 lb bags of pre-mixed concrete it takes to make a cubic yard or cubic foot, for small pours.